Tip induced quantum dot
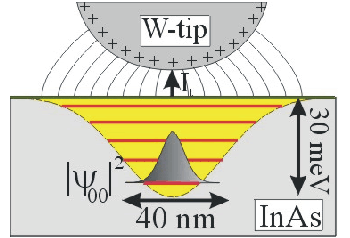
Fig. 1: Sketch of the tip induced quantum dot
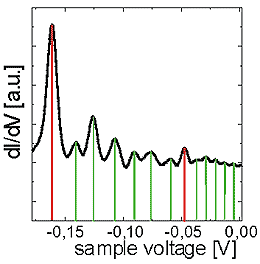
The tip induced quantum dot is often present, if scanning tunneling microscopy on a semiconducting surface is performed. It results from the work function difference between sample and tip leading to an electric field, which is screened by the charge carriers of the sample. In contrast to metals, where the screening length is below 1 Å, semiconductor screening lengths are of the order of several nm. Thus a considerable band bending is induced into the semiconductor leading to complete confinement in the conduction band of the sample, i.e. a semiconductor quantum dot (Fig. 1). On InAs(110), the quantum dot states are measurable in dI/dV-curves (Fig. 2). In magnetic fields the corresponding states are classified as Landau levels of different spin (Fig. 3). Consequently the spin splitting of the quantum dot levels can be measured. Thus, we have access to a property of the quantum dot, which has been proposed as the basic unit of a quantum computer. The so called qubit should be the entanglement of two spin states of the quantum dot.
 |
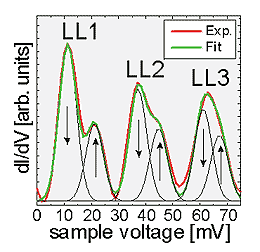 |
| Fig.2: dI/dV-spectrum of the quantum dot at 0 T showing the quantized levels marked by vertical lines | Fig.3: Quantum dot spectrum at B = 6 T showing different Landau (LLn) and spin levels (arrows) |
This would not be very interesting, if the tip induced quantum dot has not the unique property, that it can be moved with the tip to different positions on the sample surface. Since the semiconducting sample exhibits a complicated potential landscape, the confinement potential of the quantum dot is different at each position and the influence of slight changes in the confinement on the spin splitting can be directly measured. We find a complicated dependence guided by the non local character of the exchange interaction (Fig. 4). However, a quantitative understanding of the data is still missing.
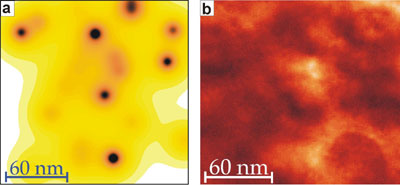
Fig. 4: Map of the spin splitting as a function of quantum dot position (a) in comparison with the surface potential of the same area (b) visualizing the non local character of the exchange interaction