Atomic force microscopy
In atomic force microscopy (AFM) [1] a sharp tip, mounted at the free end of a cantilever, scans a sample surface in a two-dimensional pattern by means of a piezoelectric scan unit (scanner), see figure 1a. Within a certain distance between tip and surface, tip-sample interactions lead to a mechanical response (deflection) of the cantilever, figure 1b. Measuring this response allows for the analysis of the various interaction forces, such as long-range electrostatic and magnetostatic forces, as well as the short-range chemical and magnetic exchange force, with a sensitivity of a few pN. Typical forces and their range are sketched in figure 1c.

Fig. 1: a) Sketch of a macroscopically flat surface probed by a sharp tip. In our set-ups the sample is mounted on the scanner, while the probe tip is fixed in position. b) At small separations the atomic structure of tip and sample become important. c) By approaching the surface from a certain height in z-direction various distance dependent electromagnetic long- and short-range (interatomic) forces are detected.
Two principal modes of operation are used, the static and the dynamic mode. In the static mode the cantilever is scanned relative to the sample while in contact or not in contact (e.g. several 10 nm above the surface). Attractive (repulsive) tip-sample forces bend the cantilever towards (away) from the sample. According to Hooke's law the magnitude of the tip-sample force is proportional to the cantilever deflection.
In the dynamic mode the cantilever is oscillated at or near by its resonance frequency. Depending on the way of excitation the cantilever is externally driven or self-oscillating. Any tip-sample interaction influences amplitude, phase or frequency of the cantilever. During oscillation the tip may (tapping) or may not (non-contact) touch the surface at the lower turnaround point. It is not as straightforward as in the static mode to quantify the magnitude of the tip-sample interaction. In the case of long-range interactions the frequency shift is proportional to the force gradient.
FM-AFM
We operate our AFMs in the (ideally) non-destructive dynamic mode. It is also called non-contact (nc) or near-contact AFM. We use silicon tips mounted on a silicon cantilever with spring constant cz as force probes. The mechanical response of the cantilever due to the interaction with the surface is detected by means of laser interferometry. The cantilever is deliberately vibrated during scanning and the change in cantilever resonance frequency, Δf=f-f0, is detected. This mode is called frequency-modulation AFM (FM-AFM) [2]. AFM is a real-space imaging technique that reveals surface features such as terraces, islands and steps, that is, the topography, cf. figure 2Atomic resolution
Height differences in atomically resolved images reflect variations of the magnitude of the atomic forces between the foremost tip atom and the surface atoms underneath. However, AFM data is always a convolution of sample topography and tip geometry. Hence, the lateral resolution of AFM strongly depends on (i) the sharpness of the tip (probe size) and (ii) the probe sample distance. Consequently, true atomic resolution in force microscopy requires an atomically sharp tip, i.e., a stable atomic configuration at its apex with one atom protruding, and a stable tip sample distance of the order of interatomic distances, i.e. below one nanometer.Condition (i) is often fulfilled, because for many atomic configurations at a tip apex, one atom protrudes. In the static mode condition (ii) usually cannot be fulfilled, since soft cantilevers have to be used to obtain a reasonable force resolution. Therefore, the tip snaps to the surface before and a suitable distance cannot be adjusted. If tip and sample are in contact, typical contact areas contain several ten atoms. The atomic scale contrast in the static contact mode reflects the translational periodicity of the sample and is governed by friction forces. Point defects or monoatomic step cannot be imaged with atomic resolution.
In the dynamic mode the measured quantity is the frequency shift. Soft springs are not a prerequisite to achieve sufficient force sensitivity. Moreover, the restoring force in the lower turnaround point allows the adjustment of tip sample distances of the order of some tenth of a nanometer. However, atomic resolution and imaging of individual point defects has only be achieved in vacuum, were the cantilever is not damped, and therefore enables higher force sensitivity.
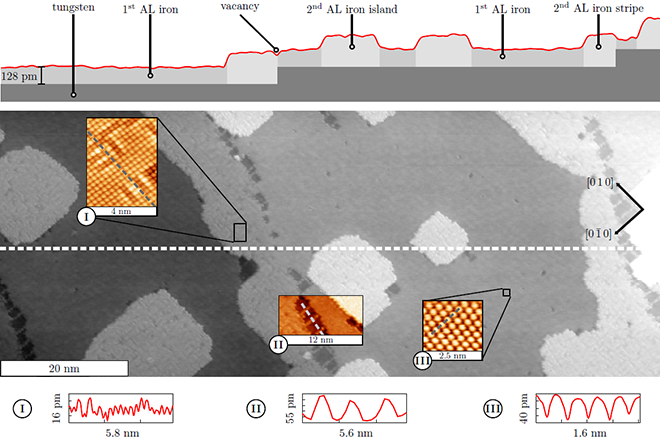
In figure 2 the capability of AFM is shown on the sample surface of ~1.3 monolayers iron grown on tungsten (001). The topography reveals a stepped tungsten substrate covered by little more than one layer of pseudomorphically grown iron. Atomic resolution images (colored) reveal different characteristics of first and second atomic layer (AL) iron, as well as other features, with a z-resolution of only a few pm.

Fig. 2: Morphology of Fe/W(001). Larger scale overview and atomic resolution images obtained with AFM.
Magnetic Exchange Force Microscopy (MExFM)
With the FM-AFM based magnetic exchange force microscopy (MExFM) [3] magnetic nanostructures can be mapped with atomic resolution combined with sensitivity to single spins by using a probe with magnetically sensitive tip end.
MExFM allows revealing the local energy difference of spins located in the sample surface. The measured atomic scale contrast is dominated by electron mediated and short-range magnetic exchange forces, that is, tip and sample are at close distance where the orbitals of foremost tip atom and sample atoms do overlap. According to the Heisenberg exchange, collinear alignment of tip and probed sample spins should lead to largest exchange energy and hence largest corrugation amplitude.
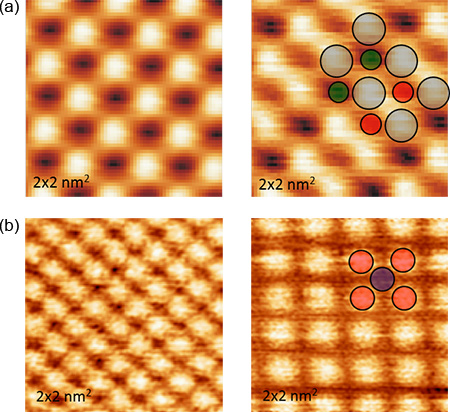
The figure presents recent results thus obtained on the antiferromagnetic insulator NiO(001) in a) and on the antiferromagnetic metal Fe/W(001) in b), respectively [4,5].
Fig. 3: a) The 3D antiferromagnetic bulk insulator NiO(001) imaged with AFM on the left (atomic resolution, protrusions are O atoms) and MExFM on the right (magnetic resolution). Due to a superexchange mechanism via the Oxygen bridge atoms, parallel rows of Ni atoms are antiferromagnetically aligned (green and red). Using a Fe-terminated tip the direct exchange between foremost Fe atom and the localized Ni 3d-atoms leads to a row wise magnetic contrast.
b) The 2D antiferromagnetic metal Fe/W(001) imaged with AFM on the left revealing chemically identical Fe atoms. Using a Fe-terminated tip the peculiar interplay of magnetic and chemical interaction between tip and sample leads to the magnetic contrast in the right, revealing antiferromagnetic Fe atoms of opposite spin direction (blue and red).
Force Spectroscopy
In contrast to imaging, spectroscopy allows to precisely measure tip-sample interaction forces across a vacuum gap in point mode, hence, without scanning. Recording the frequency shift of the oscillating cantilever in dependence of the tip-sample distance, Δf(z), reflects the total tip-sample interaction force within the probed z-range. Such curves can be converted into force curves, F(z), hence, they allow to directly measure the distance dependence of the interaction strength between tip and sample above a certain point [6].
3D-Force Field Spectroscopy
To obtain individual, site specific curves, which can be assigned with unambiguity to certain positions on the atomic lattice, it is useful to perform the spectroscopy in a 3D fashion (3D-Force Field Spectroscopy, 3D-FFS). Here, single point spectroscopy curves are recorded on all (m x m) spectroscopy points in the xy-plane and the resulting 3D-Δf(x,y,z) data set represents the total tip-sample interaction. By this, a map of atomic forces can be obtained three-dimensionally with atomic resolution [7].
Magnetic Exchange Force Spectroscopy
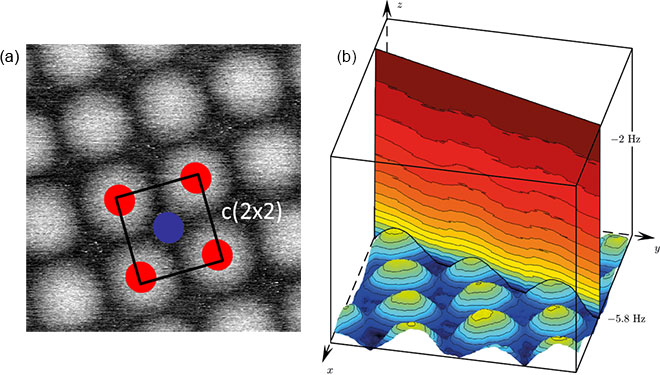
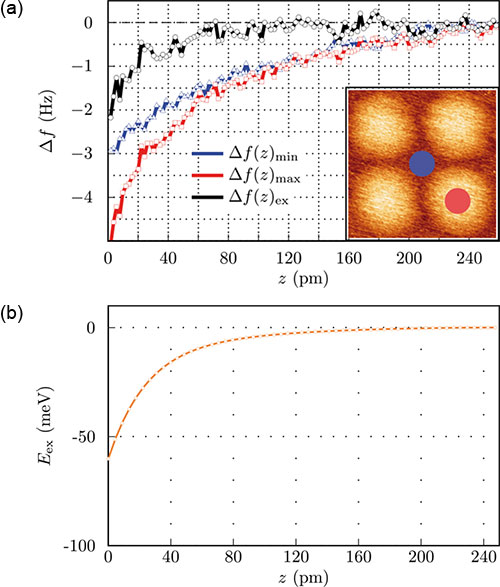
The spectroscopic mode of MExFM, that is, atomic resolution and precise distance dependent measurements of tip-sample forces by means of Δf(z)-curves combined with spin sensitivity, is referred to as magnetic exchange force spectroscopy (MExFS). Recording a 3D-data set with atomic resolution on, for example, an antiferromagnetic surface exhibiting parallel and antiparallel oriented magnetic moments with respect to the tip magnetization, allows extracting individual curves recorded on well-defined atomic sites, as shown in figure 5 a) and b). Hence, Δfap(z) on an antiparallel, and Δfp(z) on a parallel oriented moment, respectively, can be unambiguously identified and extracted, figure 5 b).

Fig. 4: a) MExFM image of the antiferromagnetic Fe monolayer on W(001). The surface magnetic unit cell is sketched. b) 3D-MExFS data set obtained on the very same surface area, 32x32 Df(z)-curves on (1.5x1.5) nm².
Both curves, as presented in figure 5 a) contain the full tip-sample interaction. However, non-site specific long-range interactions, like the van der Waals interaction, and the chemical interaction are the same on chemically identical surface atoms. Due to the supposed antiferromagnetic structure of the surface, the curves differ only by the magnetic exchange interaction between single atoms with oppositely oriented moments. Hence, the contribution due to exchange, represented by Δfex(z), is elegantly obtained by subtracting both curves from each other, Δfex=Δfap-Δfp. Afterwards, Δfex can be converted into force and energy, shown in figure 5 b).
The presented experiment performed on the antiferromagnetic Fe monolayer on W(001) shows, how MExFS allows quantitative measurements of the distance dependent magnetic exchange interaction across a vacuum gap [8].

Fig. 5: a) two curves on a minimum (blue) and a maximum (red) (cf. inset) taken from a data set as shown in figure 4 b). The difference of both curves (black) can be directly converted into energy, b). Such a curve tells us how strong the ap-configuration between tip and sample magnetic moments is favored compared to the p-configuration and how this energy difference depends on the distance. For this tip the exchange energy is about -60 meV at the smallest tip-sample separation, where the image visible in the inset in a) was recorded.

