Scannig Tunneling Spectroscopy of a 2DES at B=0 T
 |
 |
|
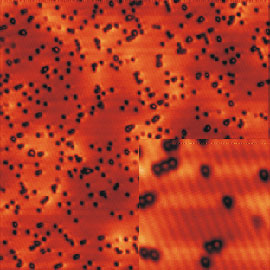
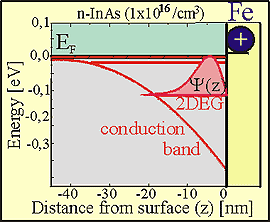
| Fig. 1: STM-image of Fe-covered InAs(110). | Fig. 2: Sketch of the adsorbate induced 2DEG. |
The two dimensional electron system (2DES) is the drosophila of electron systems. Thus it appears favorable to measure local electronic properties of such systems. Since epitaxially grown 2DESs are usually located about 100 nm below the surface, the possible spatial resolution of scanning probe techniques is quite restricted for such systems. It would be impossible to resolve features on the magnetic length scale or on the Fermi wave length . Thus, we prepared a 2DES located closer to the surface. For this, we deposited small amounts of adsorbates on a freshly cleaved InAs(110) surface (Fig. 1). The adsorbates (e.g. Fe) act as surface donors and induce a 2DES reaching up to the surface (Fig. 2). To determine subband energies of the 2DES we use Photelectron spectroscopy.
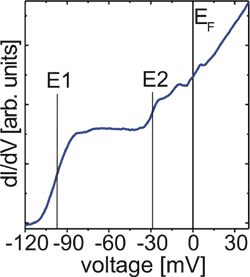
Fig. 3: Spatially averaged dI/dV-curve of the Fe-covered InAs(110) with subband energies determined by UPS indicated.
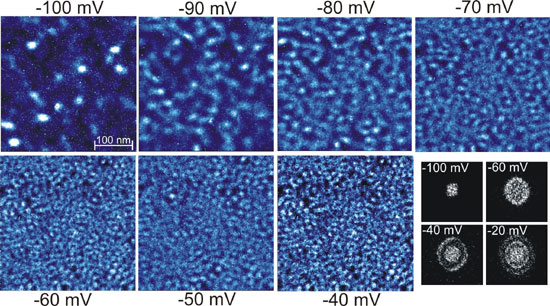
Fig. 4: dI/dV-Images of the system taken at different voltage; the four small images are Fourrier transforms of real-space images
The spatially averaged dI/dV-curve obtained on such a 2DES is shown in Fig. 3. It corresponds to the density of states of the 2DES, which, as expected exhibits steps exactly at the subband energies of the 2DES. Fig. 4 shows the corresponding LDOS patterns. They are rather irregular, but exhibit an energy dependent dominating length scale. The latter can be observed more clearly in the Fourrier transforms representing the k-space distribution of the images. A ring structure at the dominatig length scale appears. This ring corresponds to the expected wave length of the not disordered InAs conduction band. By single -particle calculations we could also show that the additional contributions in k-space originate from the wave function mixing by the disorder.
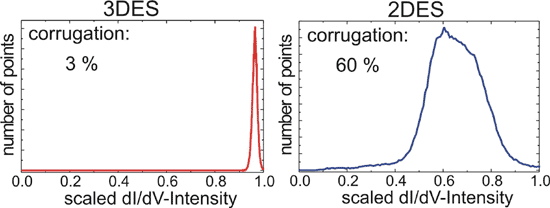
Fig. 5: Histogram of the spatially fluctuating dI/dV-intensities in a 2DES and in a 3DES. Corrugation values are indicated
Importantly, the corrugation strength of the LDOS in this 2DES is a factor of 20 larger than in the corresponding 3DES, albeit kinetic energy and disorder strength are the same (see Fig.5). We interpret this strong corrugation as well as the irregular patterns as a consequence of the tendency of a 2DES to weakly localize.
Note that the disorder potential is measured directly if the tip exhibits a tip induced quantum dot (link to page tip induced quantum dot). An example of a disorder potential is shown in Fig. 6.
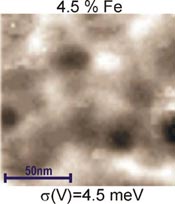
Fig. 6: Disorder potential of the 2DES at 4.5 % Fe coverage; full grey scale corresponds to 20 meV