Recent Results
Scannig Tunneling Spectroscopy of a strongly disorderd 2DES
If the disorder in a 2DES is sufficiently strong, it is often described by
classical percolation theory, i.e. the potential landscape is simply filled
up with a fluid representing the electrons. Then an energy dependent
transition from fillings where all electrons are located in isolated
potential valleys to fillings where a percolating sea is obtained
exists. Also the apparent and intriguing metal-insulator transition
in a 2DES has been described within such a picture.
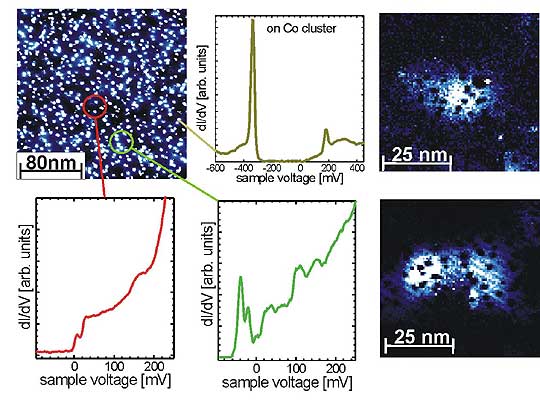 |
| Fig. 1: left: STM image of the Co-covered InAs(110) with three dI/dV-
curves originating from the marked regions. They represent the Coulomb blockade
on the clusters (yellow curve), usual 2DES regions (red curve) and 2DES regions containing
a quantum dot (green curve);
on the right, dI/dV images obtained at the energies of the peaks in the green curve are
shown exhibiting s- and p-like symmetry. |
Using Co as an adsorbate to induce the 2DES, we were able to provide
such a strongly fluctuating potential landscape. The reason is that
the Co forms islands which due to Coulomb blockade are only singly
charged. Consequently, the charge distribution
inducing the 2DES exhibits strong
statistical fluctuations leading to a strongly fluctuating potential.
Fig. 1 gives an overview on the obtained results. The upper left
image is a STM image showing the Co islands. The surrounding dI/dV-curves
are obtained in different regions of the sample. Directly on a Co-cluster
we see Coulomb gaps having a width of about 500 meV (dark yellow curve).
In some regions between the clusters, we find step like features
indicating the 2DES (red curve). However in other regions, additional
sharp peaks are observed at lower energy (green line). The spatial
distribution of the LDOS at the peak energies is shown at the right of
Fig. 1. Obviously
the LDOS exhibits s-like and p-like symmetry as expected for states in a
quantum dot. Thus, at these low energies quantum dots are distributed
in the isolated valleys of the potential landscape.
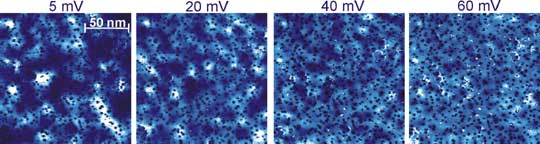 |
| Fig. 2: dI/dV-Images of the 2DES obtained at different voltages around the percolation threshold. |
Pictures of the LDOS at higher energy are shown in Fig. 2.
The LDOS apparently covers more and more of the surface as expected for
a percolation transition. An indication of this percolation is a
rather aprubt decrease of corrugation strength as shown in
Fig. 3. We deduce a percolation threshold around 30 meV, which is indeed
the subband energy of the 2DES calculated for the not disordered case.
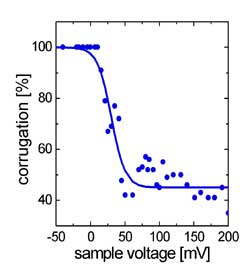 |
| Fig. 3: corrugation strength of the 2DES LDOS as a function of energy showing a distinct drop around the percolation threshold. |
Related Publications
J. Wiebe, Chr. Meyer, J. Klijn, M. Morgenstern, and R. Wiesendanger,
Phys. Rev. Lett., submitted:
From Quantized States to Percolation: Scanning Tunneling Spectroscopy of a Strongly Disordered Electron System.
|
 |
|
Introduction to STM | Instrumentation | Results / Projects | Gallery | Publications | Team
impressum © copyright 2002 by group R - university of hamburg